
Texas Population Projections Program
The Texas Demographic Center generates biennial population projections for the state and its counties by age, sex, and race/ethnicity. The projections should be used only with full awareness of the inherent limitations of population projections and with detailed knowledge of the procedures and assumptions delineated in the methodology document.
Vintage 2024 Projections
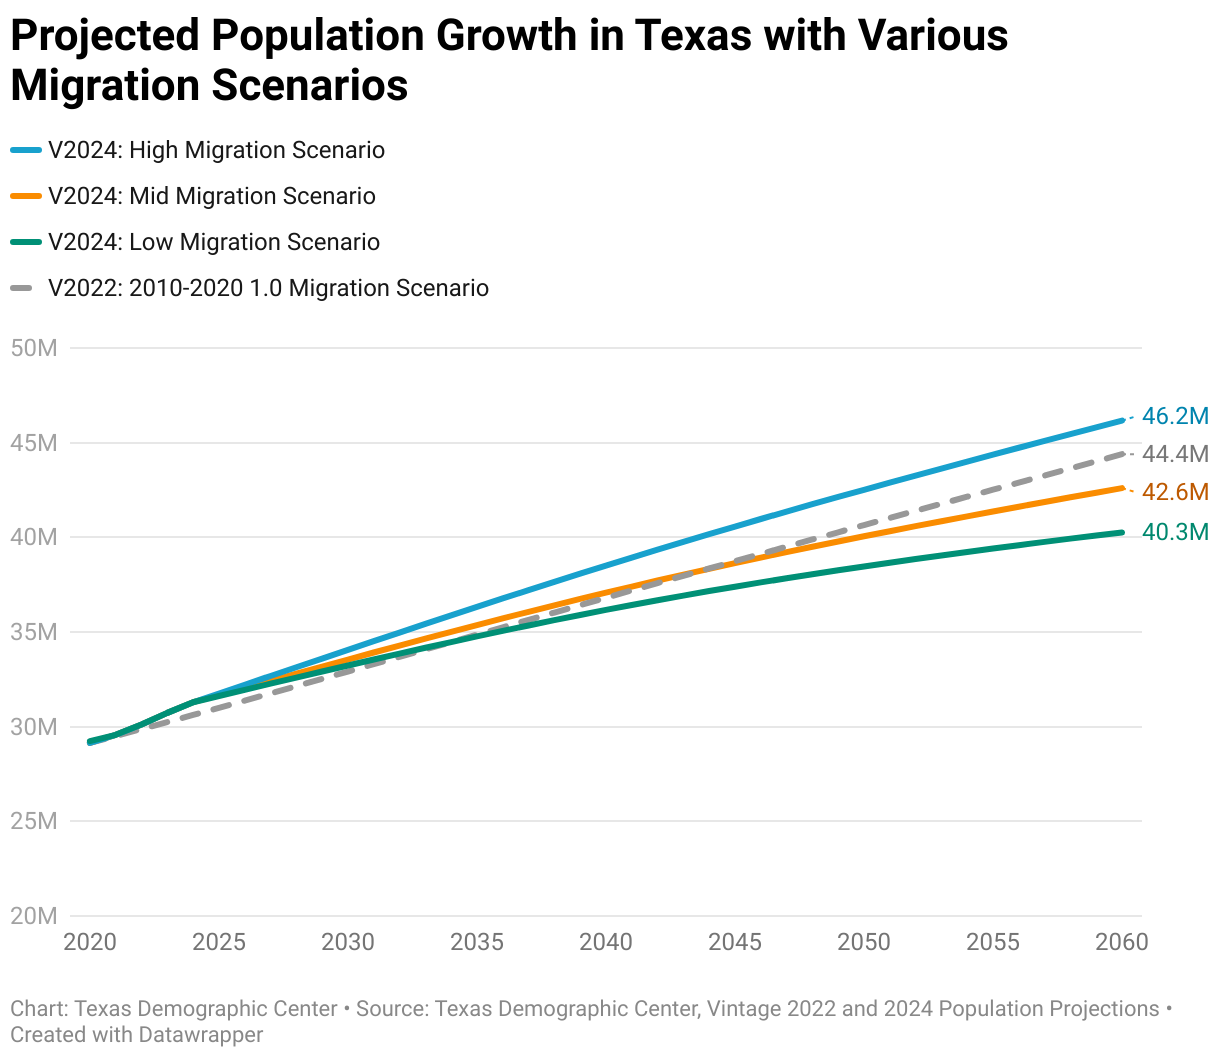
The Texas Demographic Center Vintage 2024 projections consist of the state's and its counties residential populations by age, sex, and race/ethnicity for each year from 2020 through 2060. The projections are available under three migration scenarios.
Past vintages of population projections are available upon request. Please contact us.
Population Projections Webinar
You can find a recording of our Vintage 2024 Population Projections webinar on our YouTube channel, offering a comprehensive overview of our methodology and process for our population projections program. Our PowerPoint presentation is also available if you’d like to review the material again or share it with others.
Important user notes
Major changes have been made to the Vintage 2024 methodology. Users may notice differences in the following areas:
- The data includes April 1st, 2020 Decennial Census Counts and the projection for the July 1st, 2020 population. The two 2020 records are distinguished by the “year_month” column.
- The projected population from 2020 to 2024 is aligned with the Census Bureau’s Vintage 2024 July 1st Estimates.
- The projections are available with three migration scenarios, mid, low, and high, corresponding to the three national projection series produced by the Census Bureau in 2023.
Projected Population Growth Interactive Chart
Texas County Population Projections
| Name | 2020 April |
2030 July |
2040 July |
2050 July |
2060 July |
Change 2020-2060 |
%Change 2020-2060 |
|---|
Population Projections 2020-2060
Suggested Citations
Projections Methodology
Review the methodology prior to using the data.
Build Your Own Table
Download Data
Mid Migration Scenario
Assumes the US and Texas migration patterns remain similar to the past two decades.
Recommended for most purposes.
High Migration Scenario
Assumes a higher migration scenario than the average patterns in the past two decades.
Recommended for use when immigration levels are high.
Low Migration Scenario
Assumes a lower migration scenario than the average pattern in the past two decades.
Recommended for use when immigration levels are low.