
2023 Data Visualizations

The top workforce sectors for Native Americans in Texas are in education, health, and social assistance, mirroring the state’s top sectors; yet they have a higher presence in the arts, entertainment, recreation, accommodation, and food service industries compared to Texans’ share.
Final population estimates for counties and places are now available for July 1, 2022 and January 1, 2023. The estimates of county populations by age, sex, and race/ethnicity for July 1, 2021 and July 1, 2022 are also now available. Visit our estimates webpage for additional information and data files.
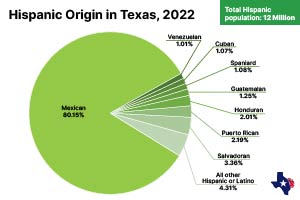
Texas' Hispanic population hit 12 million in 2022, becoming the state's largest demographic group and a key driver of population growth in the last 50 years. Ethnically rich, the fastest growth has come among those with origins in Mexico, Puerto Rico, El Salvador, and Honduras. Don't miss our Viz-of-the-Week posts every Monday and learn more about the Texas population by following us on all our social media platforms!
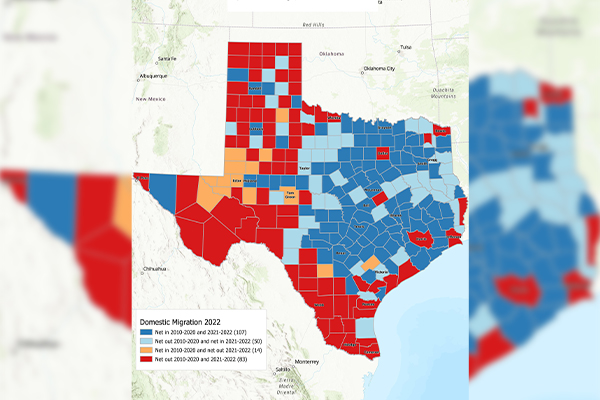
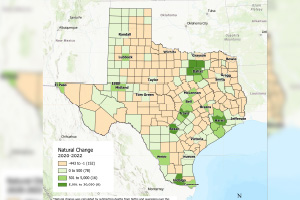
Texas and many of its counties continued with its strong population growth in the wake of the 2020 COVID-19 pandemic. In 2022, Texas’s population surpassed 30 million (30,029,572) and ranks second in the country behind California. The main driver of Texas population growth in 2022 is domestic migration, accounting for 49% of the state’s overall growth.

Texas women are making strides and surpassing men overall in educational attainment for high school completion and Bachelor’s degrees among most racial/ethnic populations.
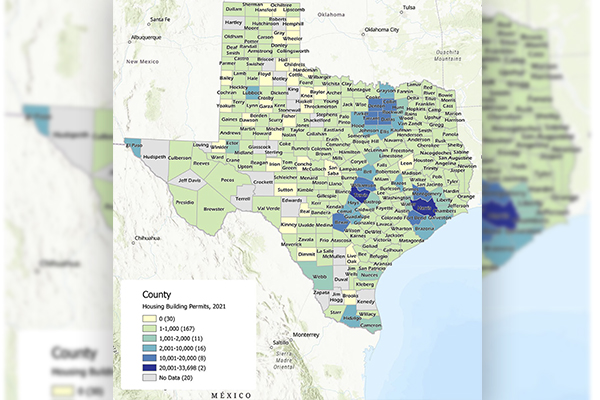
The Texas Demographic Center (TDC) collects data on building permits for residential housing from local governments on an annual basis. The data is one measure TDC uses to estimate population change for Texas cities and counties. For areas that do not respond to our survey, we supplement our data with the Census Bureau’s Building Permits Survey data. Since 2020, we have also incorporated new residential housing unit data reported from alternative sources who do not issue building permits, such as utility connections, wastewater permits, and voter registration for local governments. The 2021 new residential housing data aligns with the state’s population growth within the Texas Triangle (growth within the Houston, Dallas/Ft. Worth, and San Antonio geographic region).